Commerce Intelligence for Omnichannel Retail

Designed a reusable commerce intelligence framework that unifies sales, marketing, customer, product, inventory and financial data into a governed analytical model for decision-ready retail management.

Microsoft Fabric Power BI Omnichannel Retail Multi-Fact Star Schema
1

Business Challenge

Fragmented Commercial Data

Sales, marketplace, marketing, inventory and accounting information lived in separate operational systems.

Revenue Without Profitability Context

Top-line growth alone did not explain discounts, returns, product cost, acquisition spend or contribution economics.

Customer Value Was Hard to Compare

Acquisition channels needed to be evaluated beyond first-order revenue using repeat behavior and longer-term customer value.

Inventory Risk Was Reactive

High-margin products could move toward stockout before commercial teams connected demand, margin and days-of-supply signals.
2

Analytics Solution

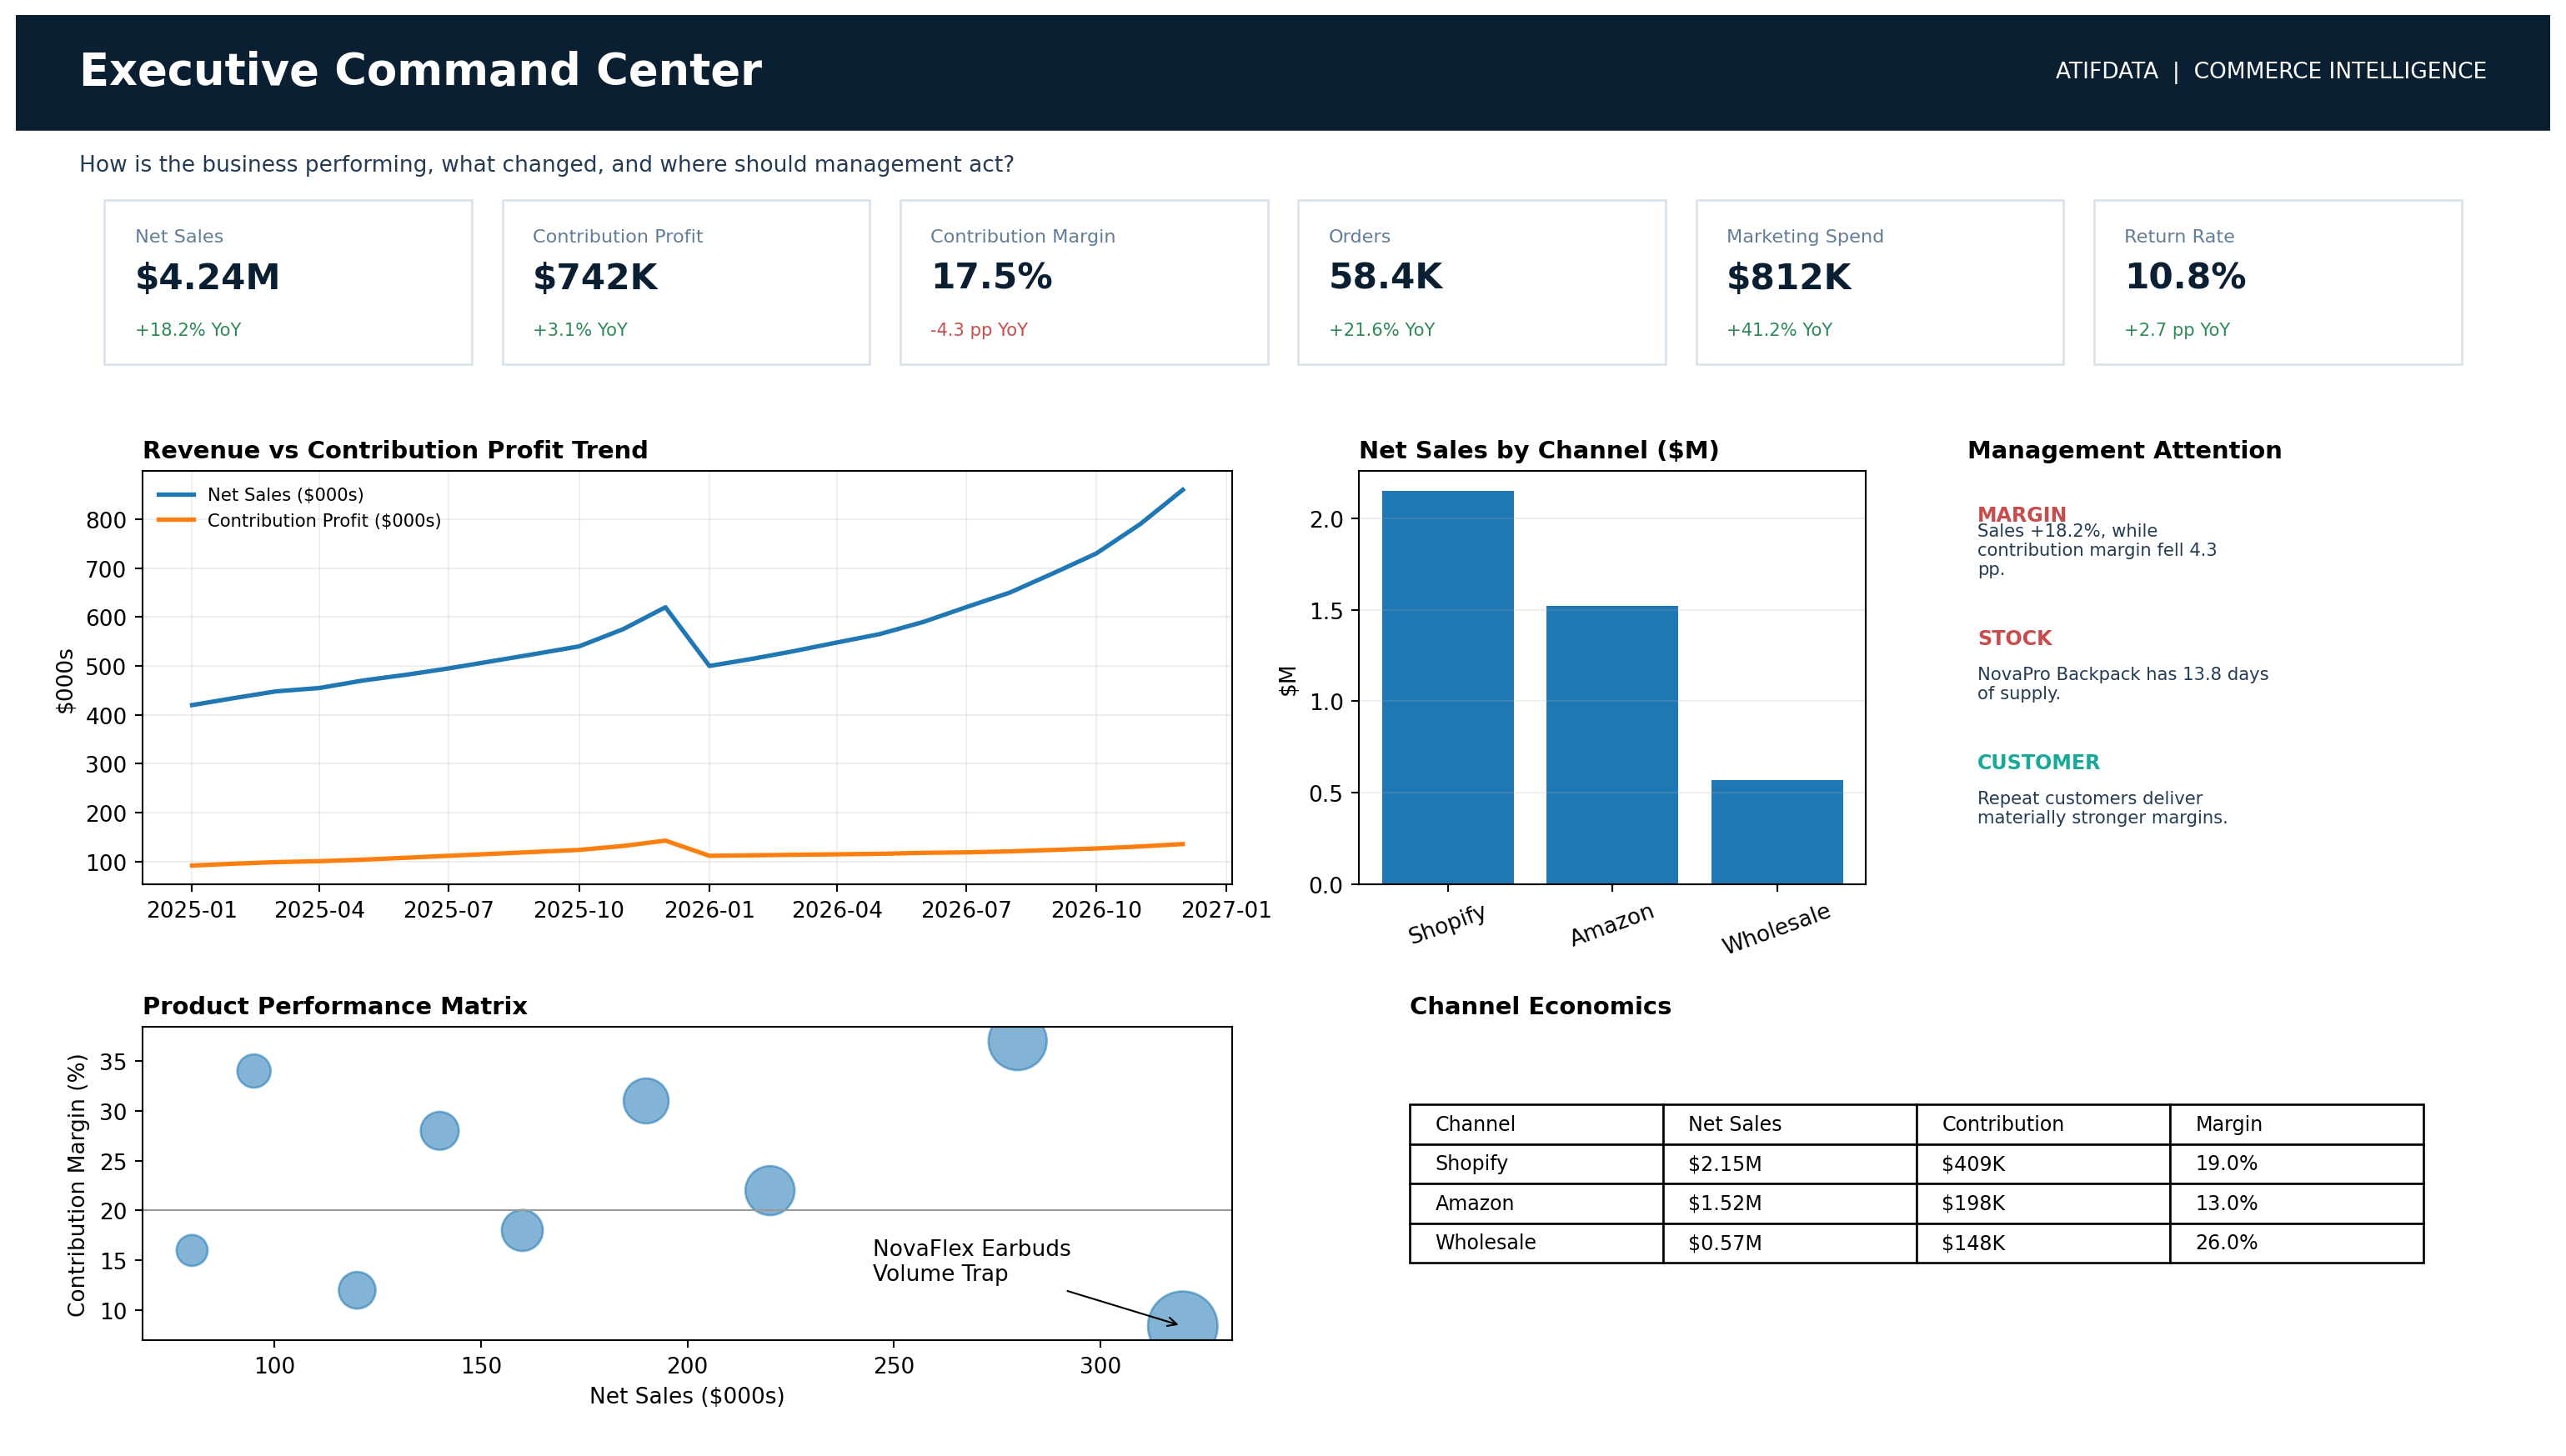
Executive Command Center

Connects sales growth, gross margin, contribution profit, returns and operational alerts in one management view.

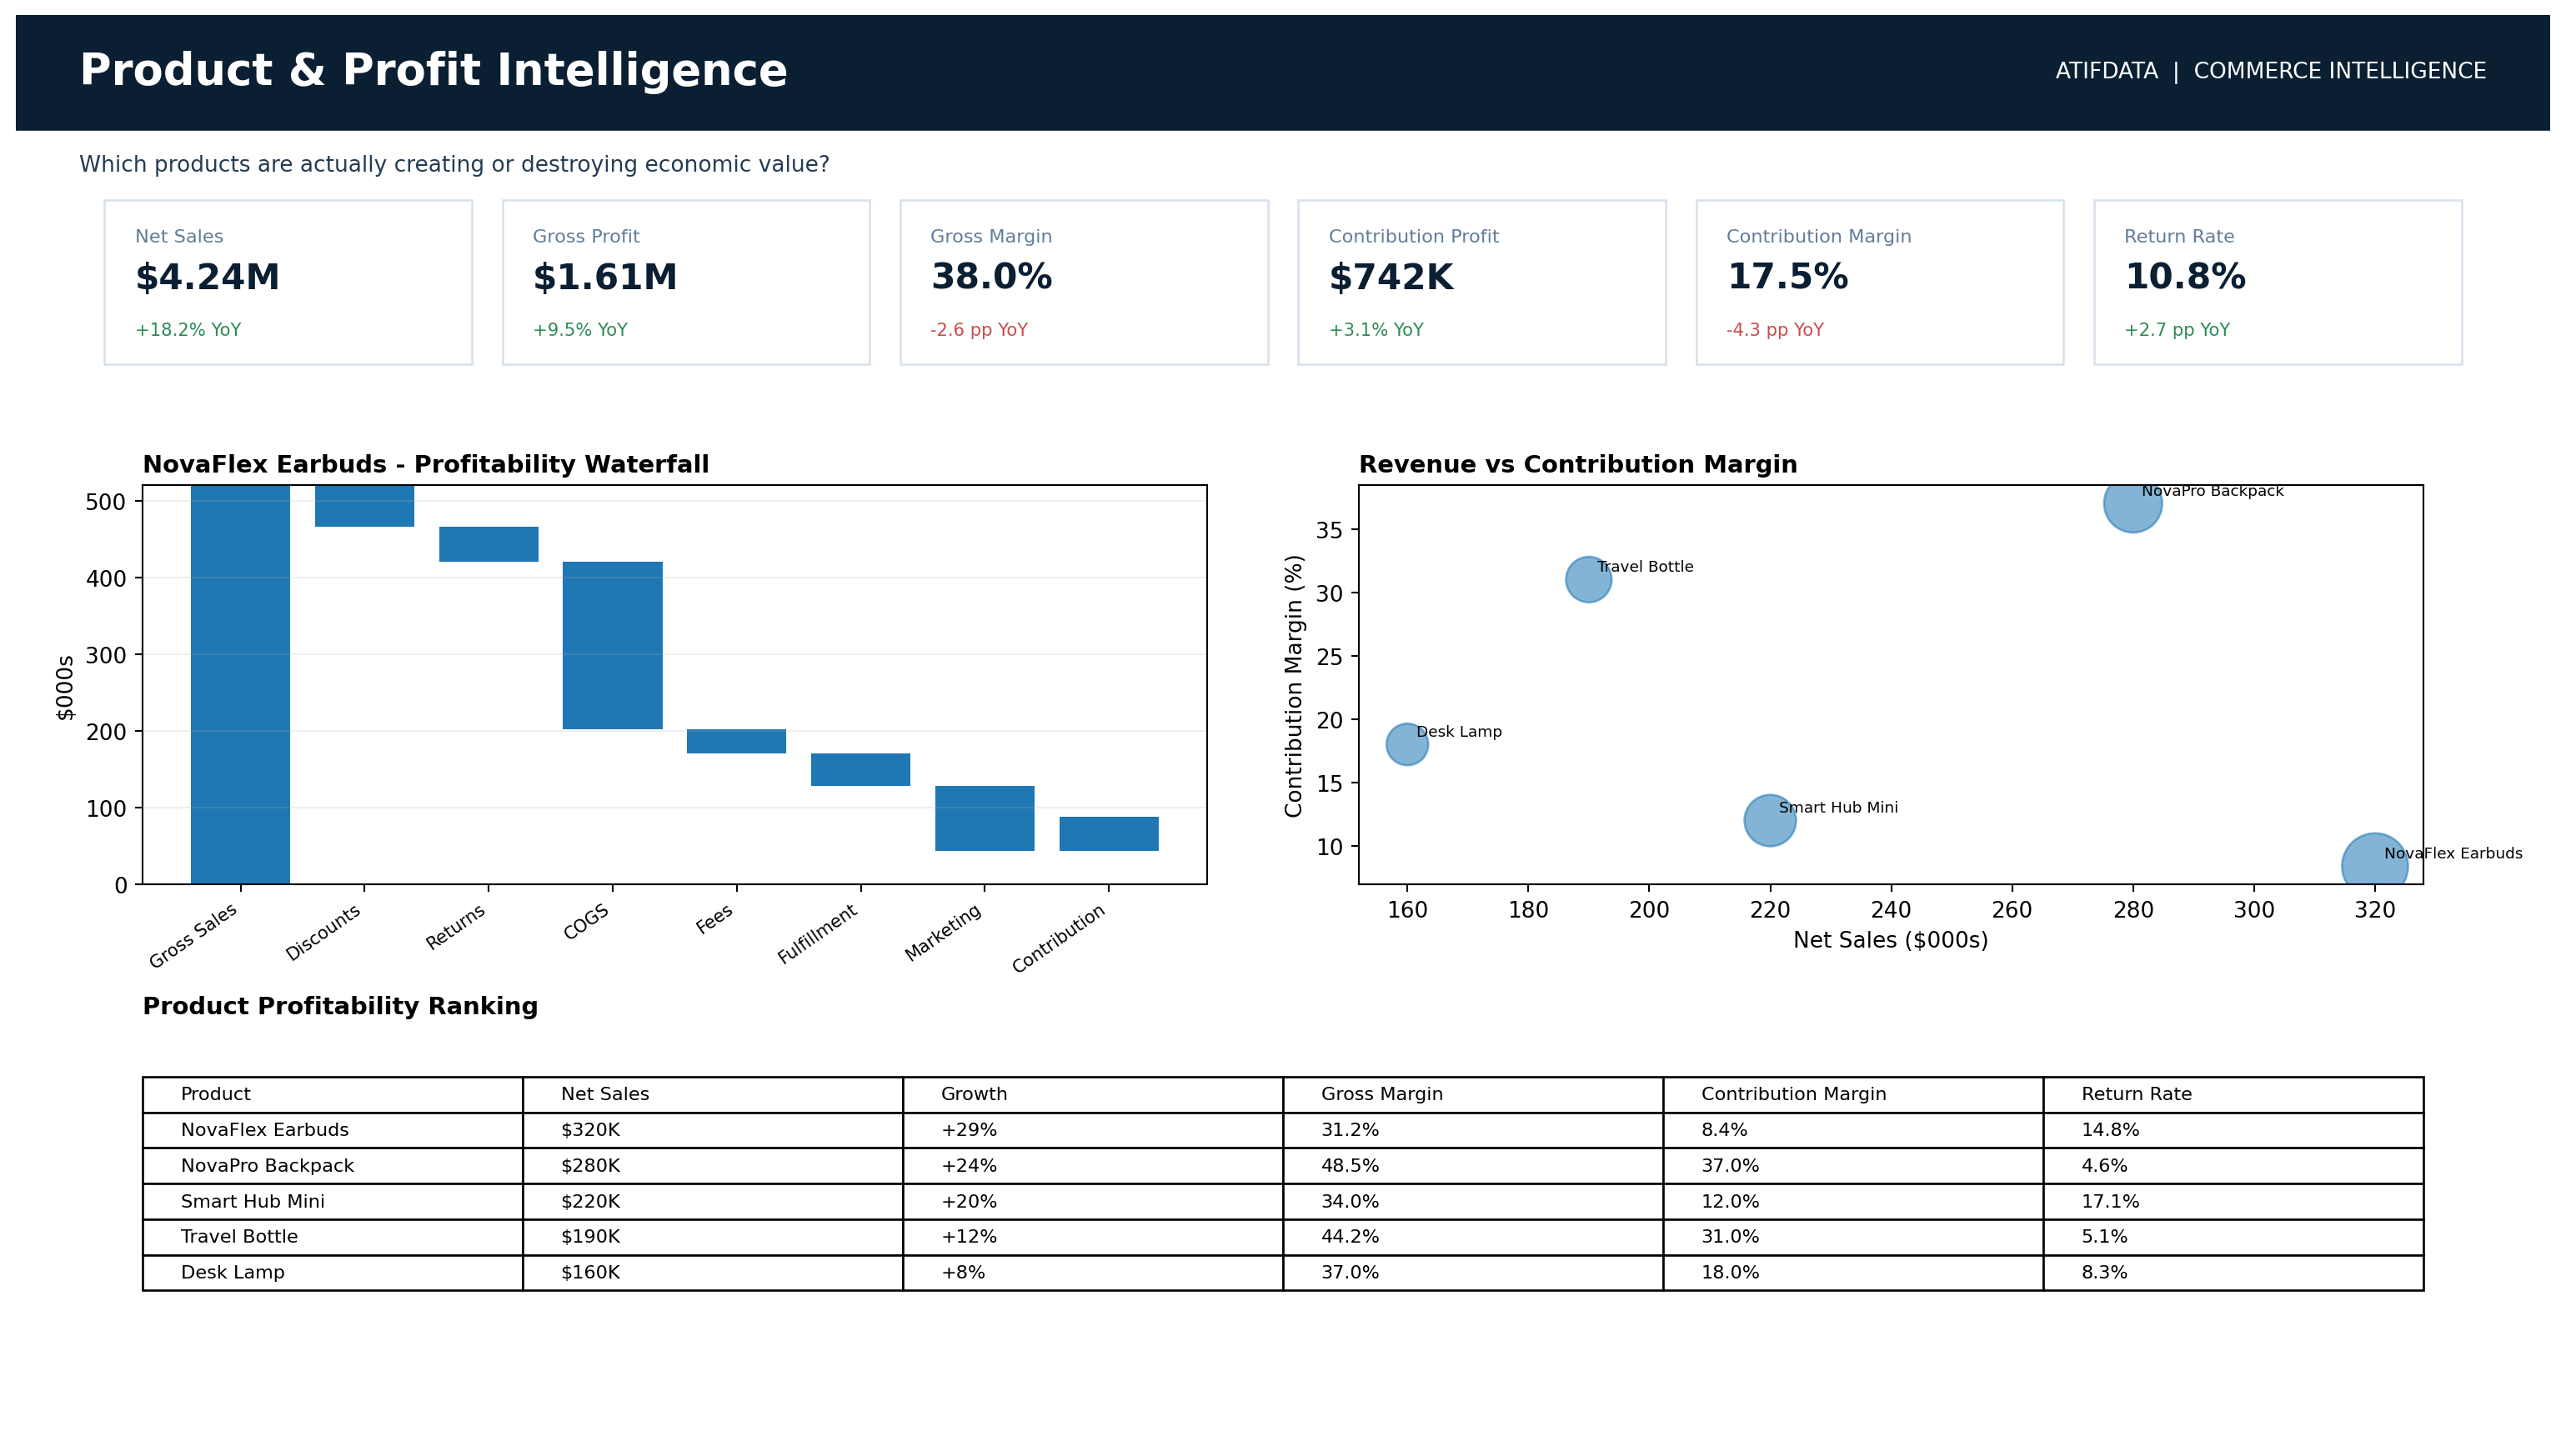
Product & Profit Intelligence

Explains product economics through sales, discounting, returns, product cost and contribution margin.

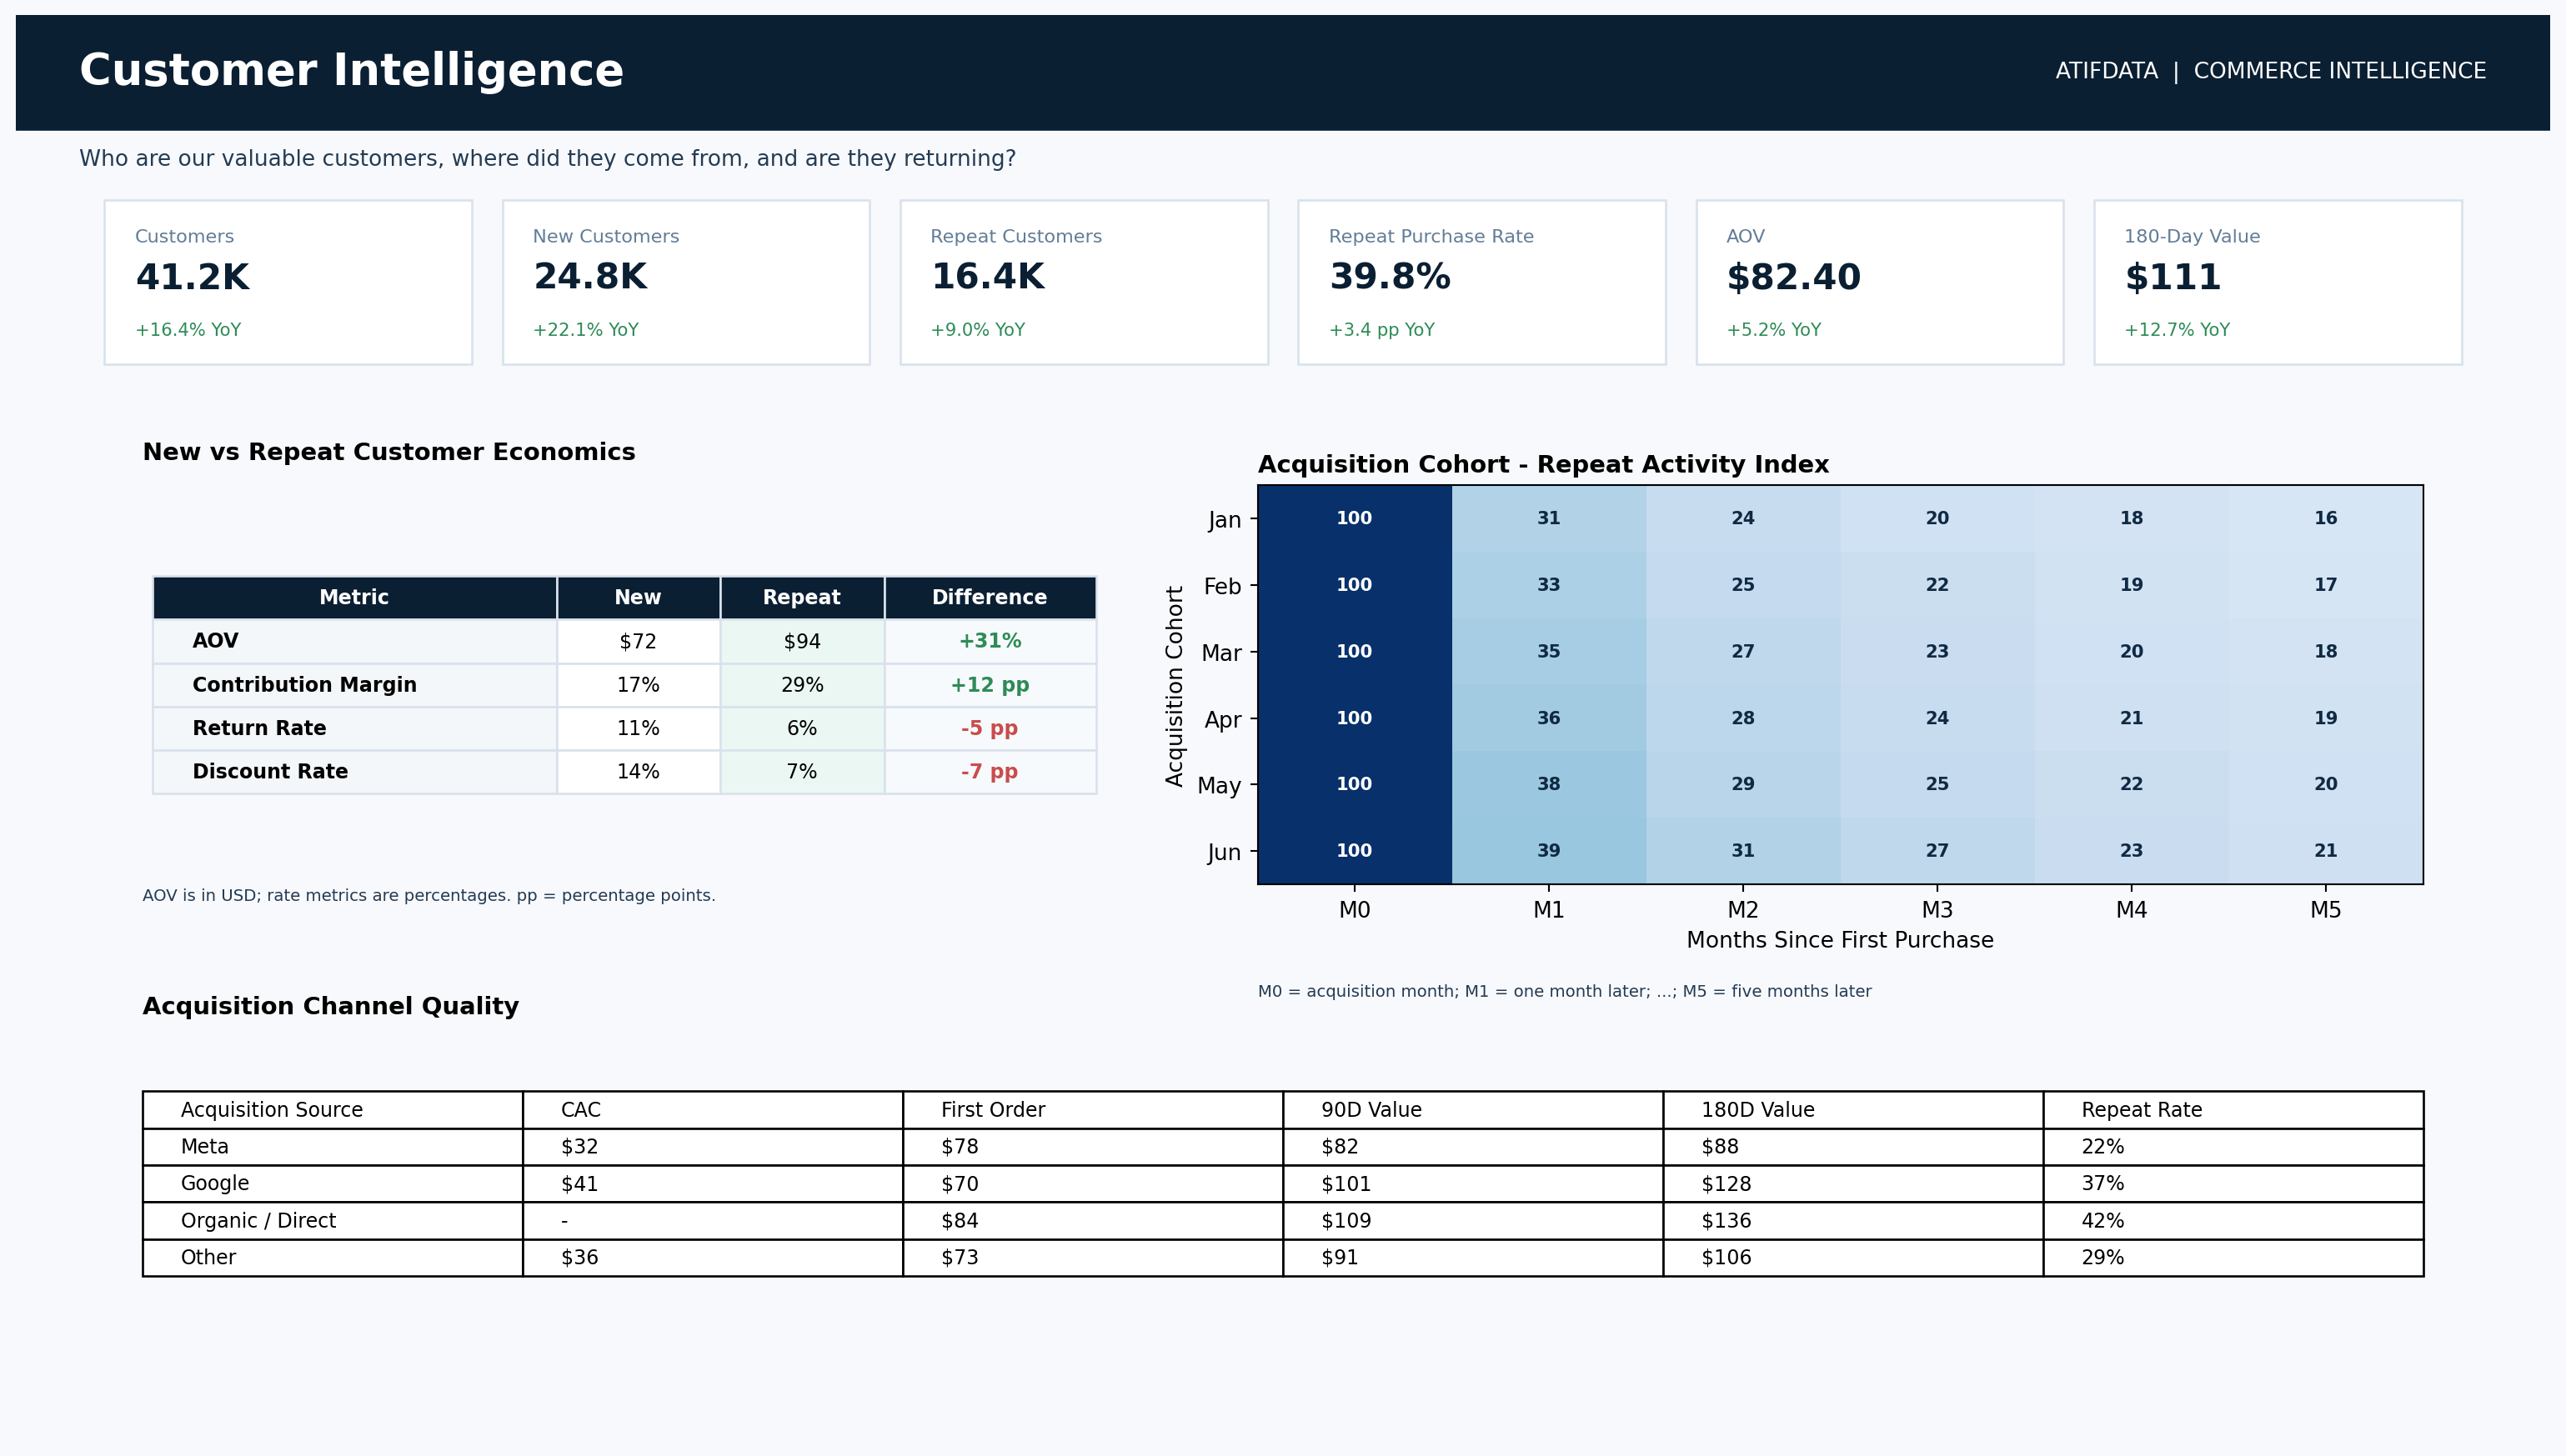
Customer Intelligence

Compares new and repeat customer economics, acquisition cohorts, repeat rates and 180-day value.

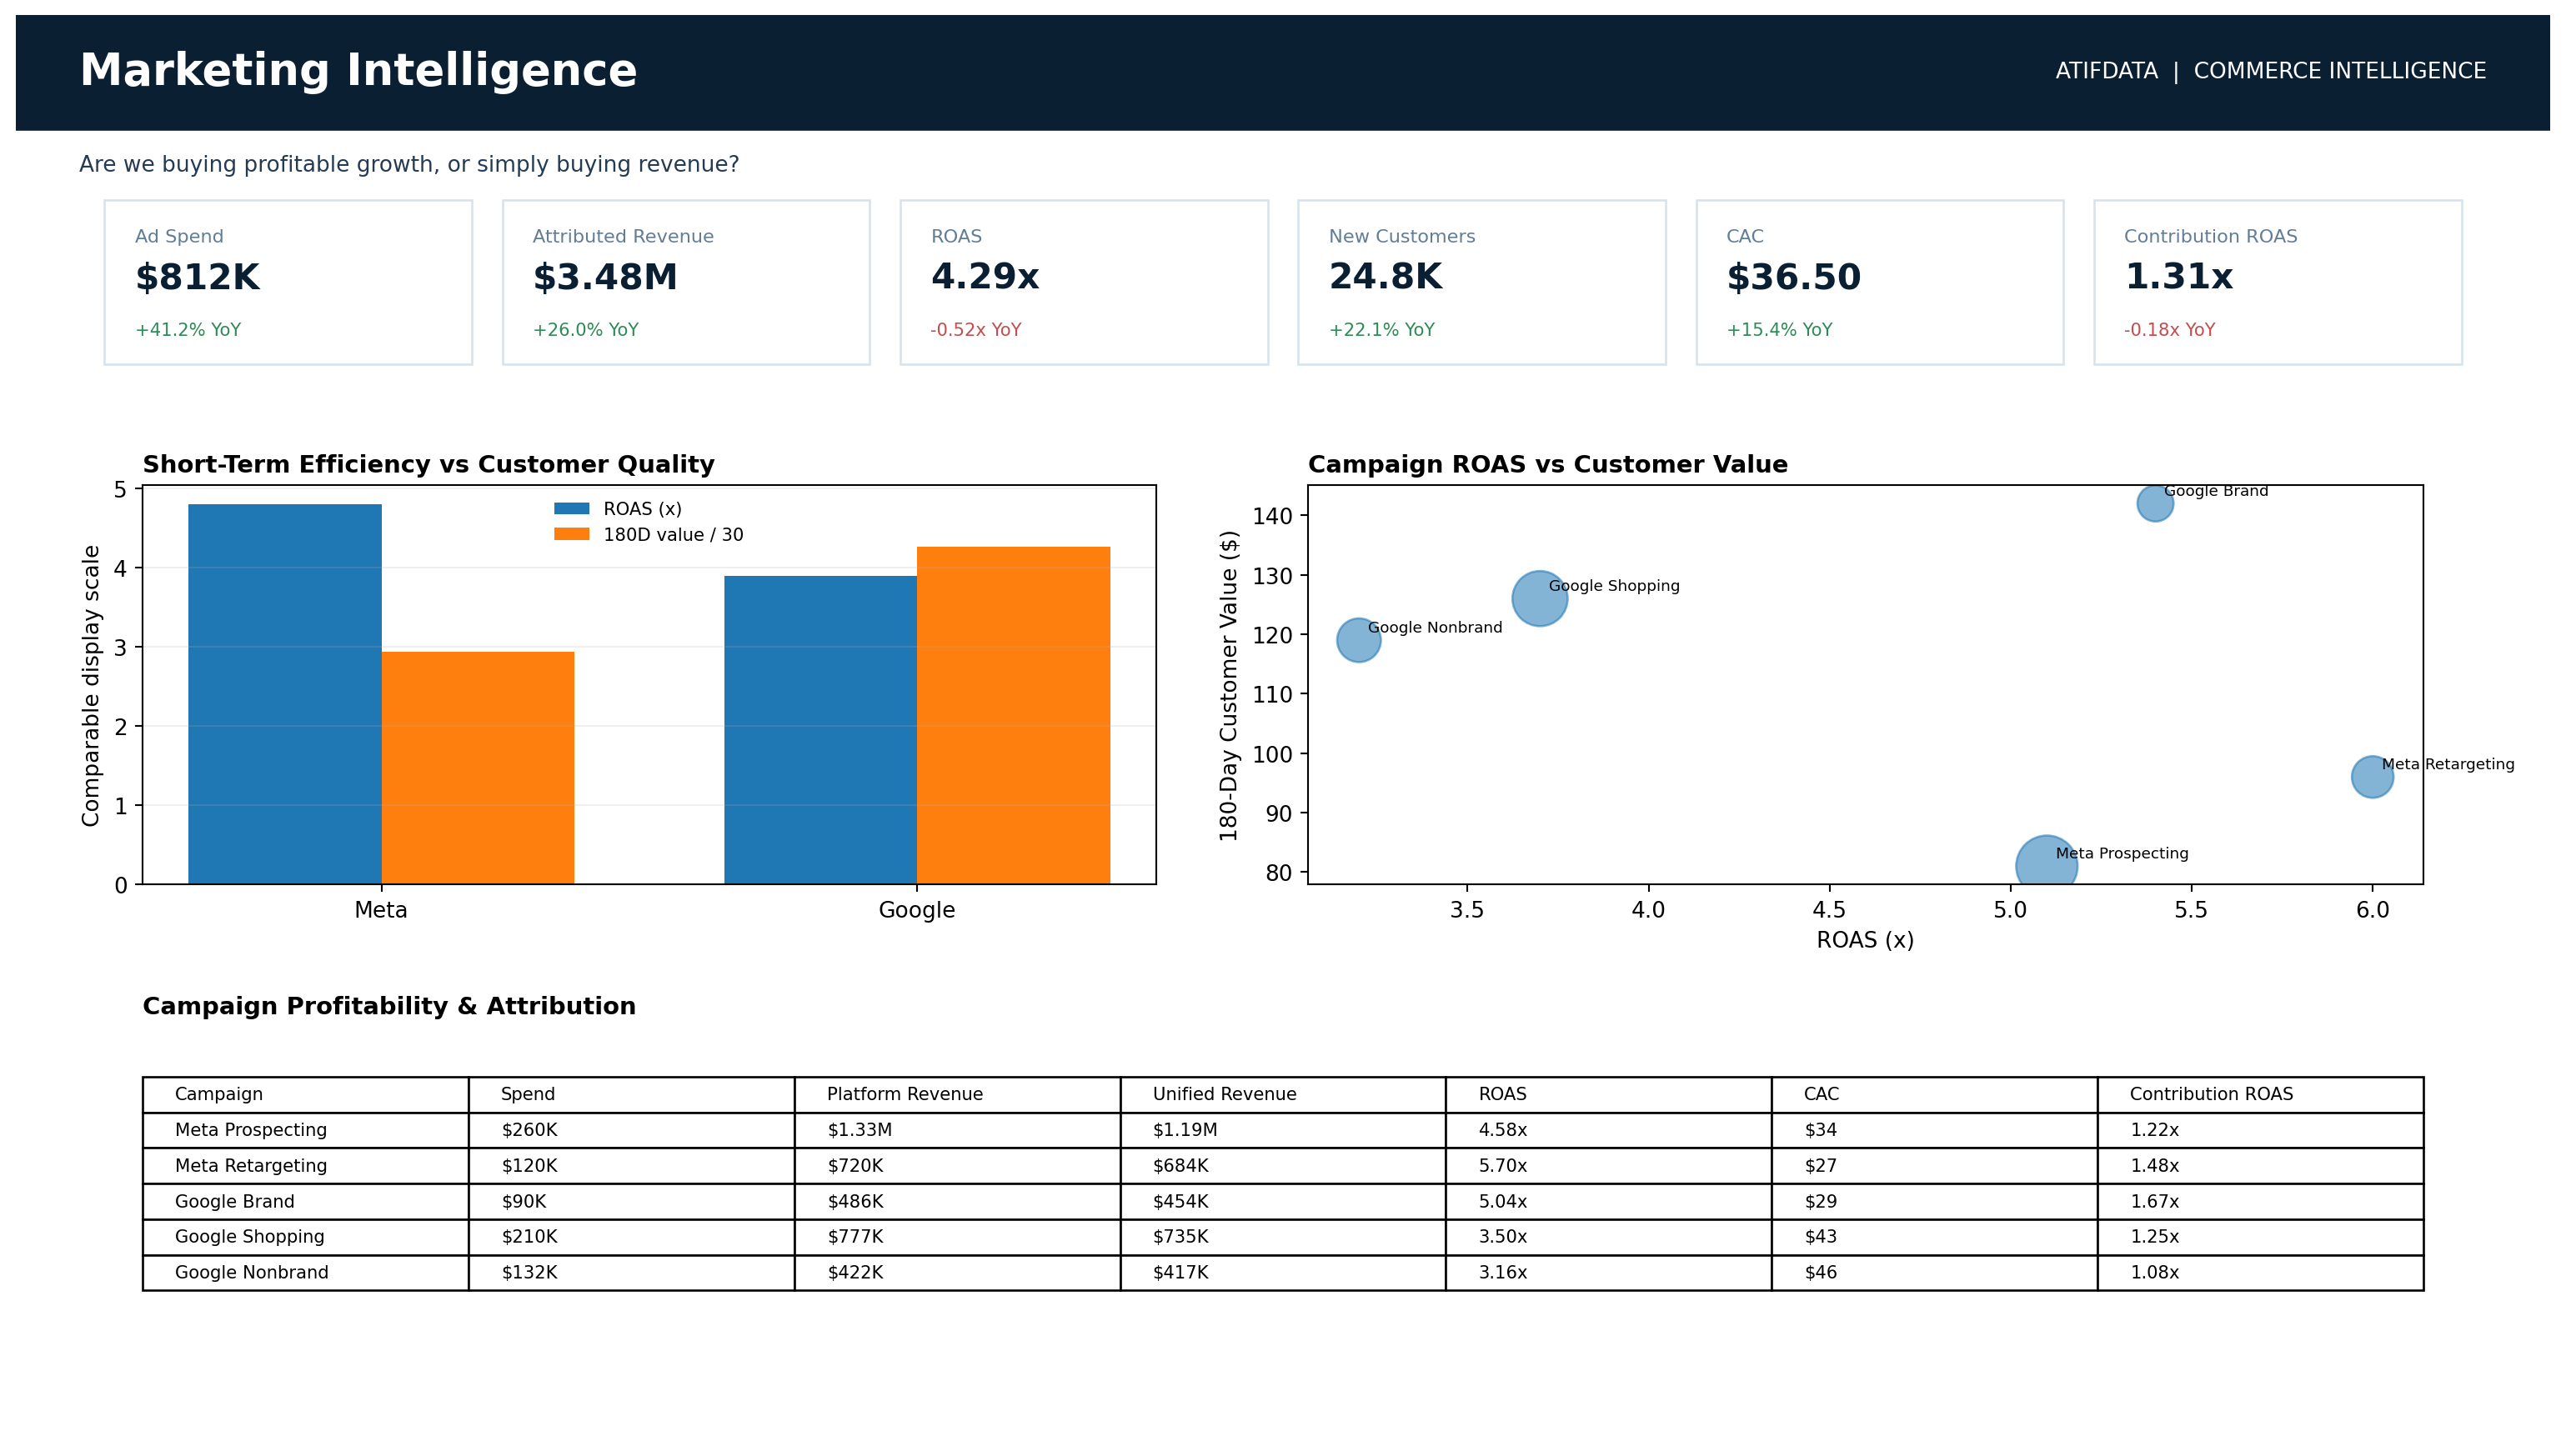
Marketing Intelligence

Connects campaign spend and customer value so acquisition quality can be evaluated beyond immediate ROAS.

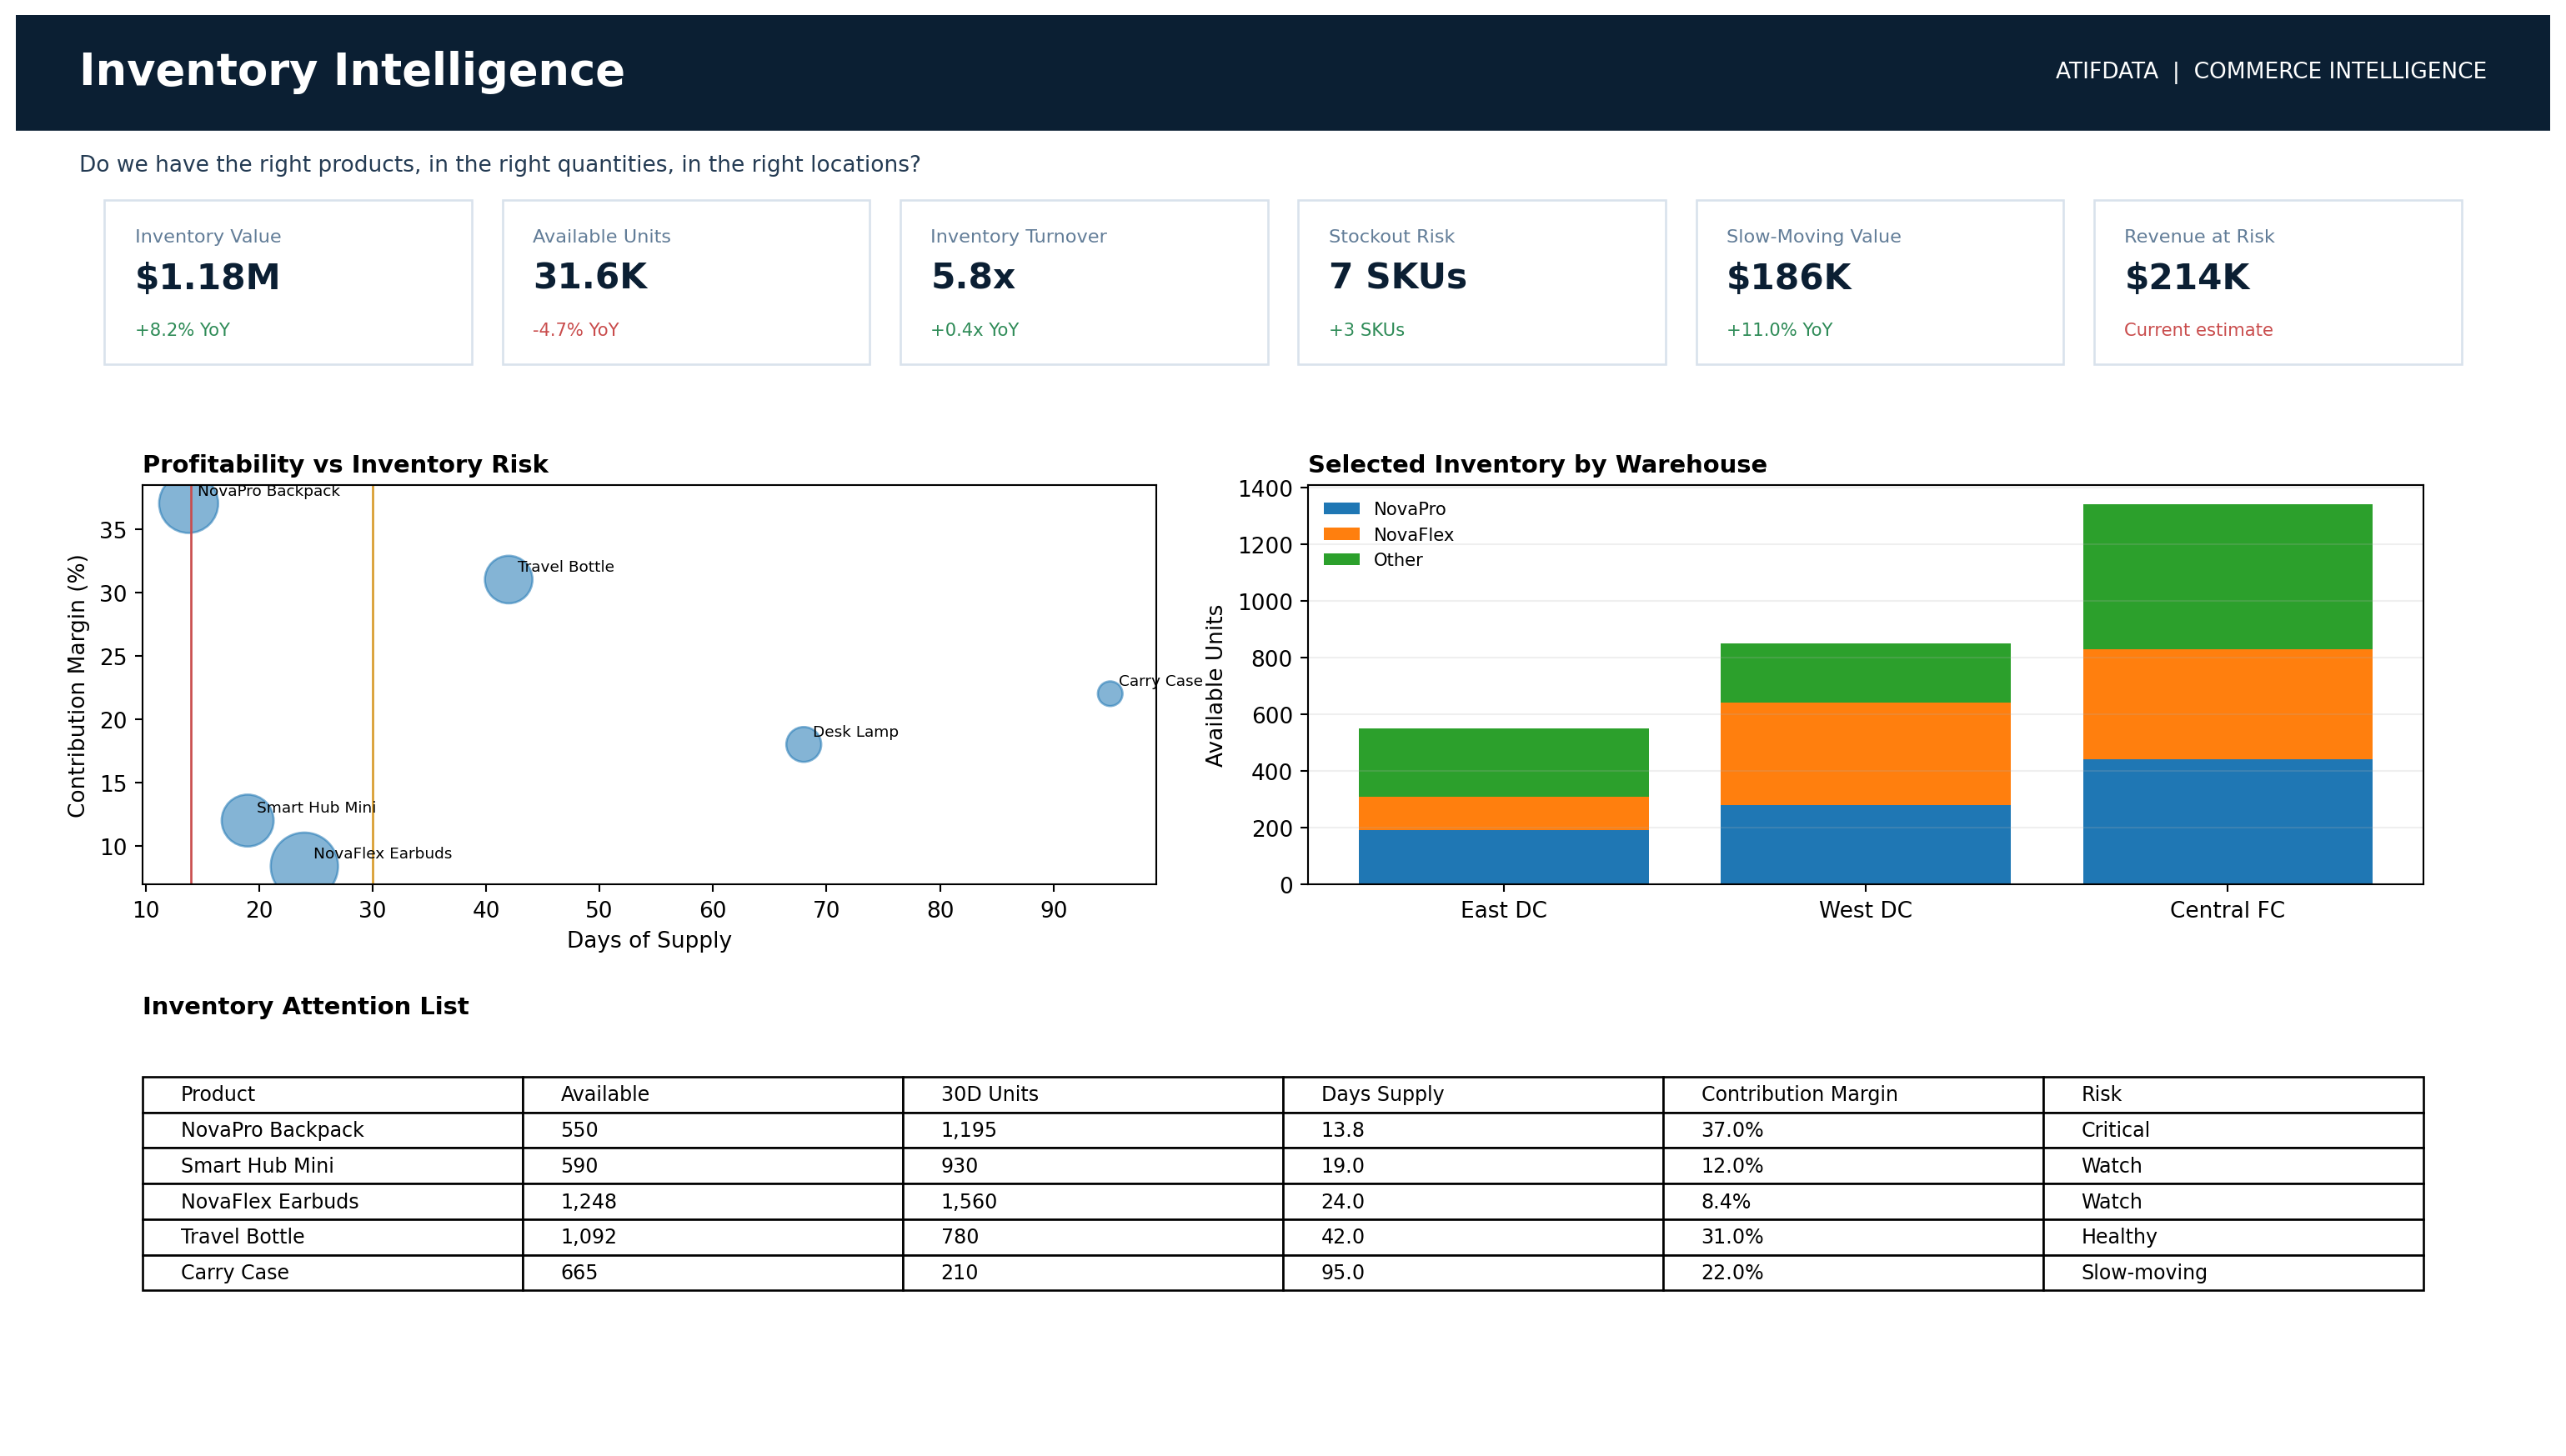
Inventory Intelligence

Combines stock, movement, margin and velocity to expose replenishment priorities and inventory risk.

Insight Rule Engine

Surfaces management attention areas such as margin deterioration, return spikes and low days of supply.

3

Business Impact

18.2%

Net Sales Growth

Scenario analytics showed strong growth while also revealing pressure on contribution economics.

-4.3 pp

Contribution Margin Change

The framework highlighted that revenue growth did not automatically translate into healthier unit economics.

13.8 days

Days of Supply Risk

A high-margin product was identified as requiring replenishment attention before a likely stockout.

+45%

180-Day Customer Value

Google-acquired customers showed materially higher 180-day value than Meta-acquired customers in the analytical scenario.

Return Risk Exposed

Smart Hub Mini showed a 17.1% return rate, creating a clear product-quality and profitability investigation point.

Repeat Customer Economics

Repeat customers showed a 12 percentage-point contribution-margin advantage in the scenario, supporting retention-focused decisions.

Figures shown in this solution are scenario-oriented analytical values used to demonstrate the decision framework and should not be presented as independently verified realized client outcomes.

4

Solution Architecture

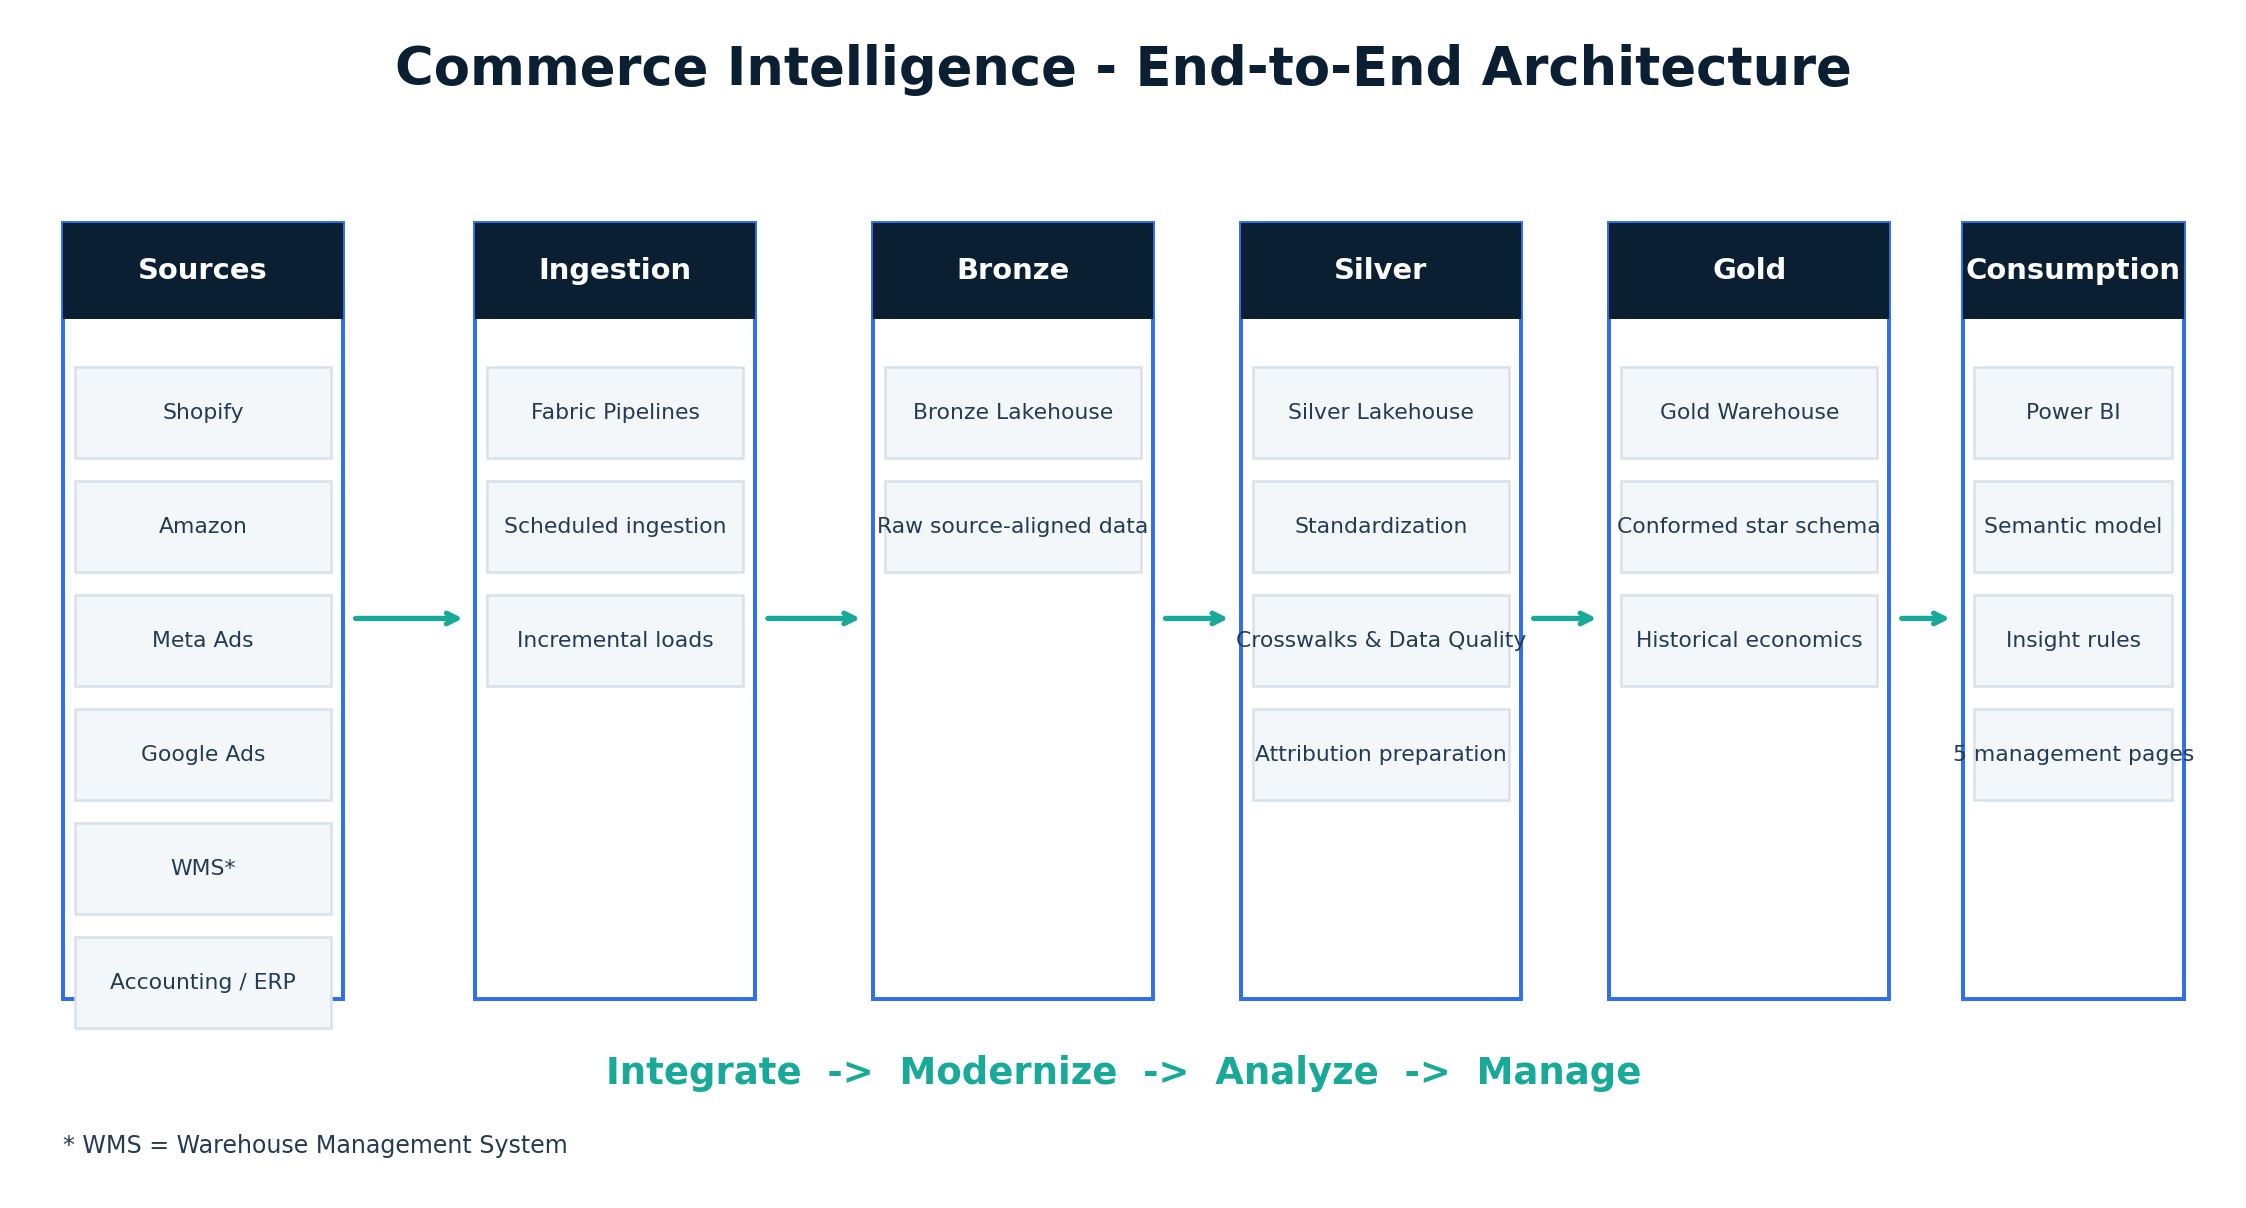
Commerce Intelligence end-to-end architecture

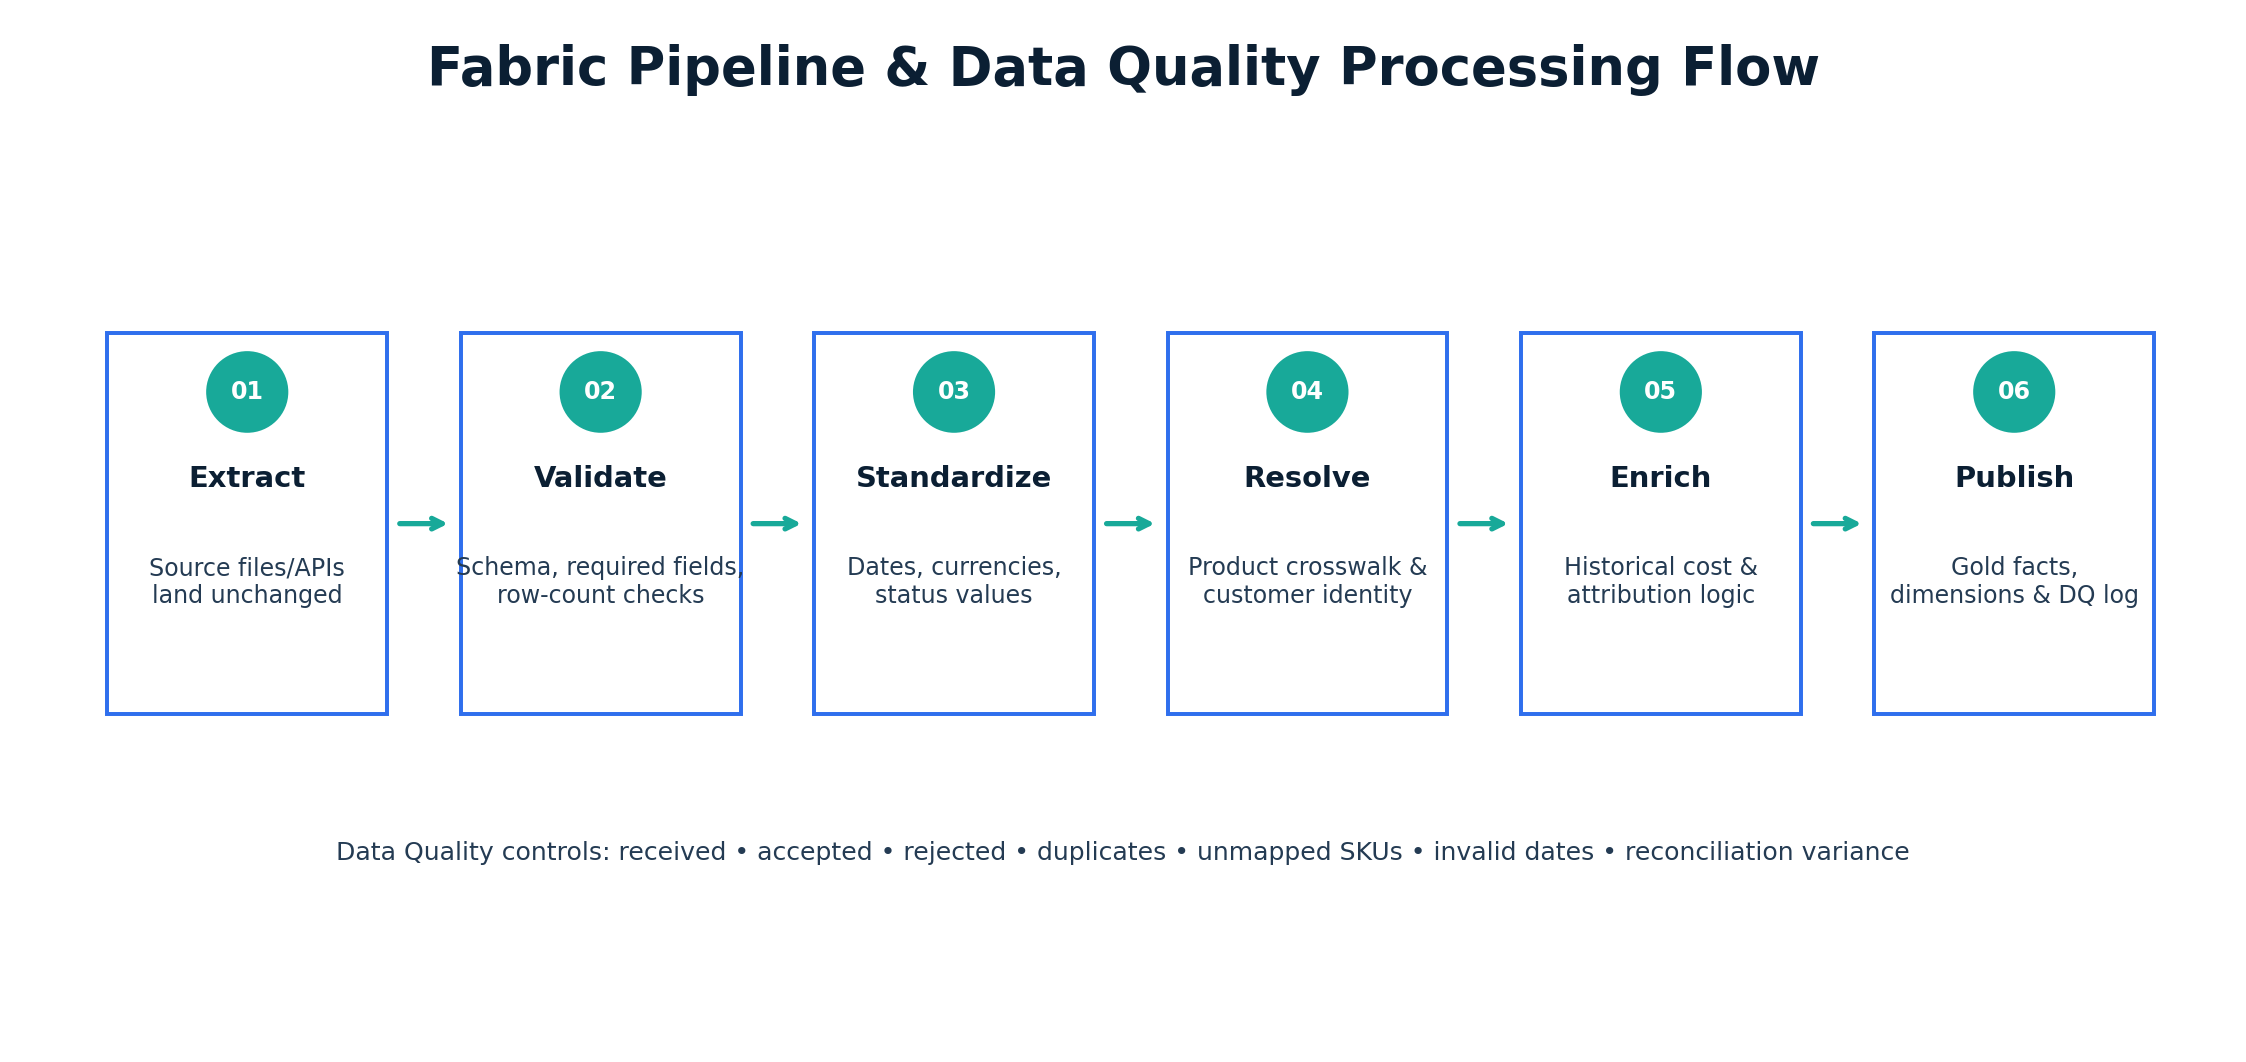
Source systems flow through Microsoft Fabric pipelines into Bronze, Silver and Gold analytical layers before Power BI delivery and insight rules.

5

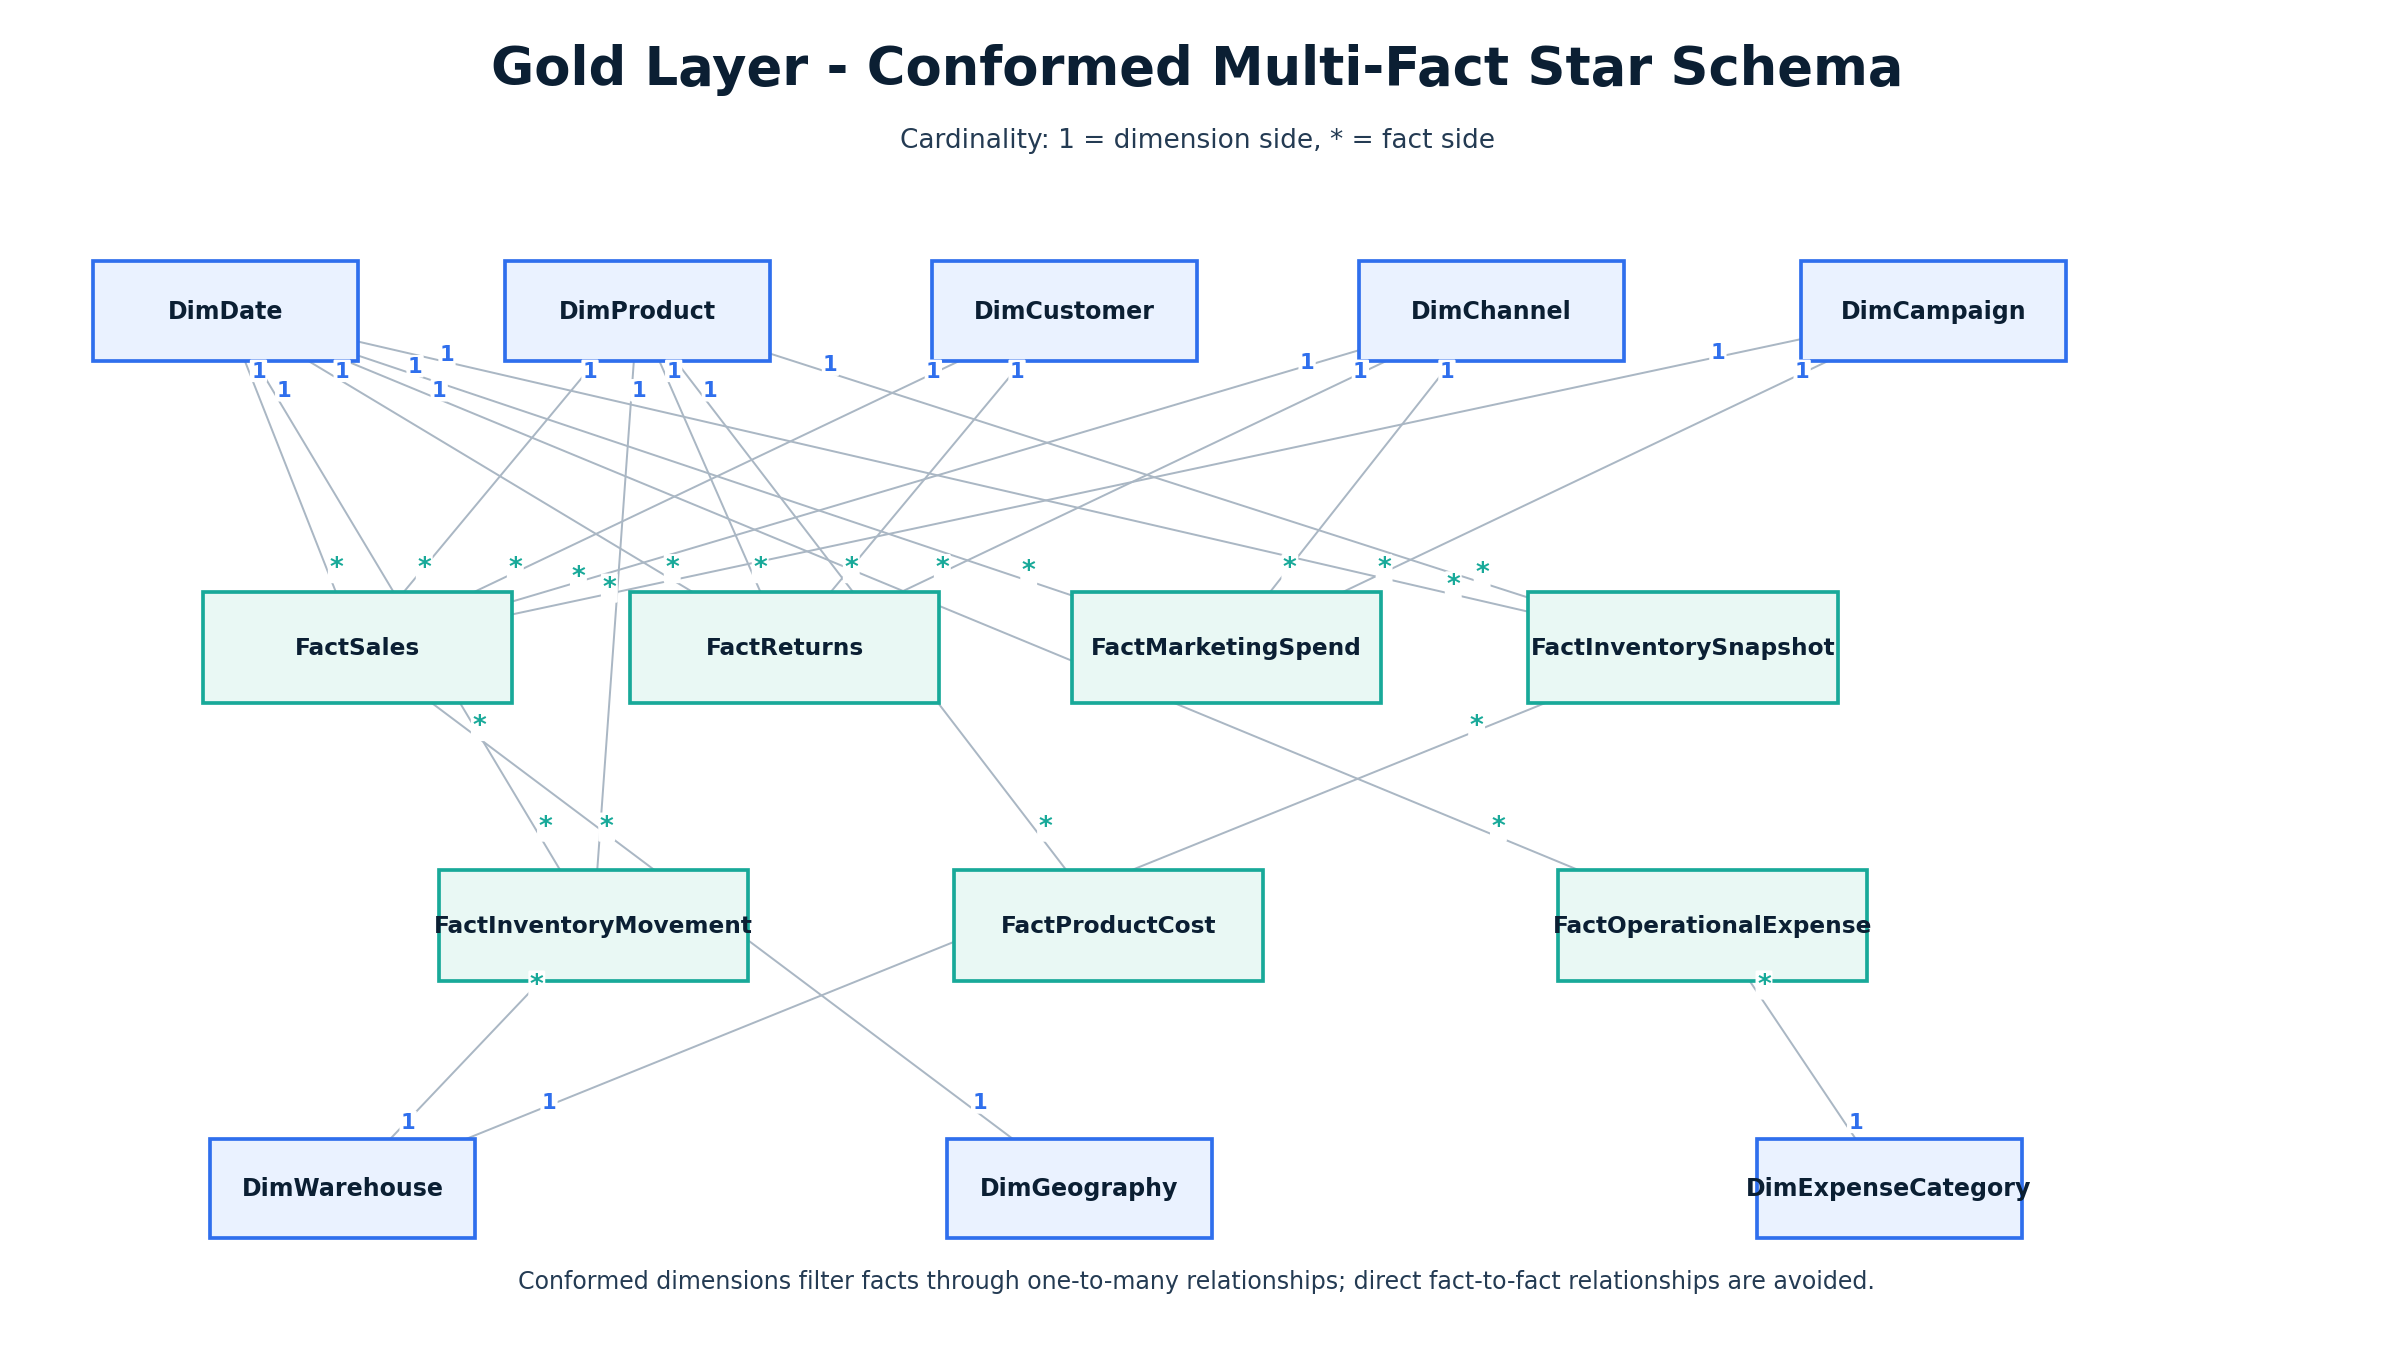
Gold Analytical Model

Commerce Intelligence multi-fact star schema

Conformed dimensions filter multiple business facts through one-to-many relationships while avoiding direct fact-to-fact joins.

6

Technology Stack

Microsoft FabricFabric Data FactoryLakehouseDelta Tables Power BIDAXPower QueryStar Schema ShopifyAmazonMeta AdsGoogle Ads
7

Dashboard Gallery

8

Supporting Data Engineering Assets

9

GitHub Repository

Explore the Commerce Intelligence Repository

Review the solution documentation, analytical design and supporting project assets.

View GitHub Repository ↗

Explore More Solutions

Browse data modernization, healthcare and cross-industry analytics case studies.

View All Solutions →